
Trading 212 performance: your real return
What your money earned with Trading 212 once deposits, fees, dividends and exchange rates are counted.
Why the Trading 212 number doesn't add up
Deposits look like gains
A return that compares your account value with what you paid misses when the money went in. A deposit made just before a rally makes the result look better than your decisions were, and one made before a drop makes it look worse.
Pies blur the picture
A pie shows its own return, but your account holds several pies, single stocks and cash. None of them tells you how the whole account did.
Time-weighted return and net return
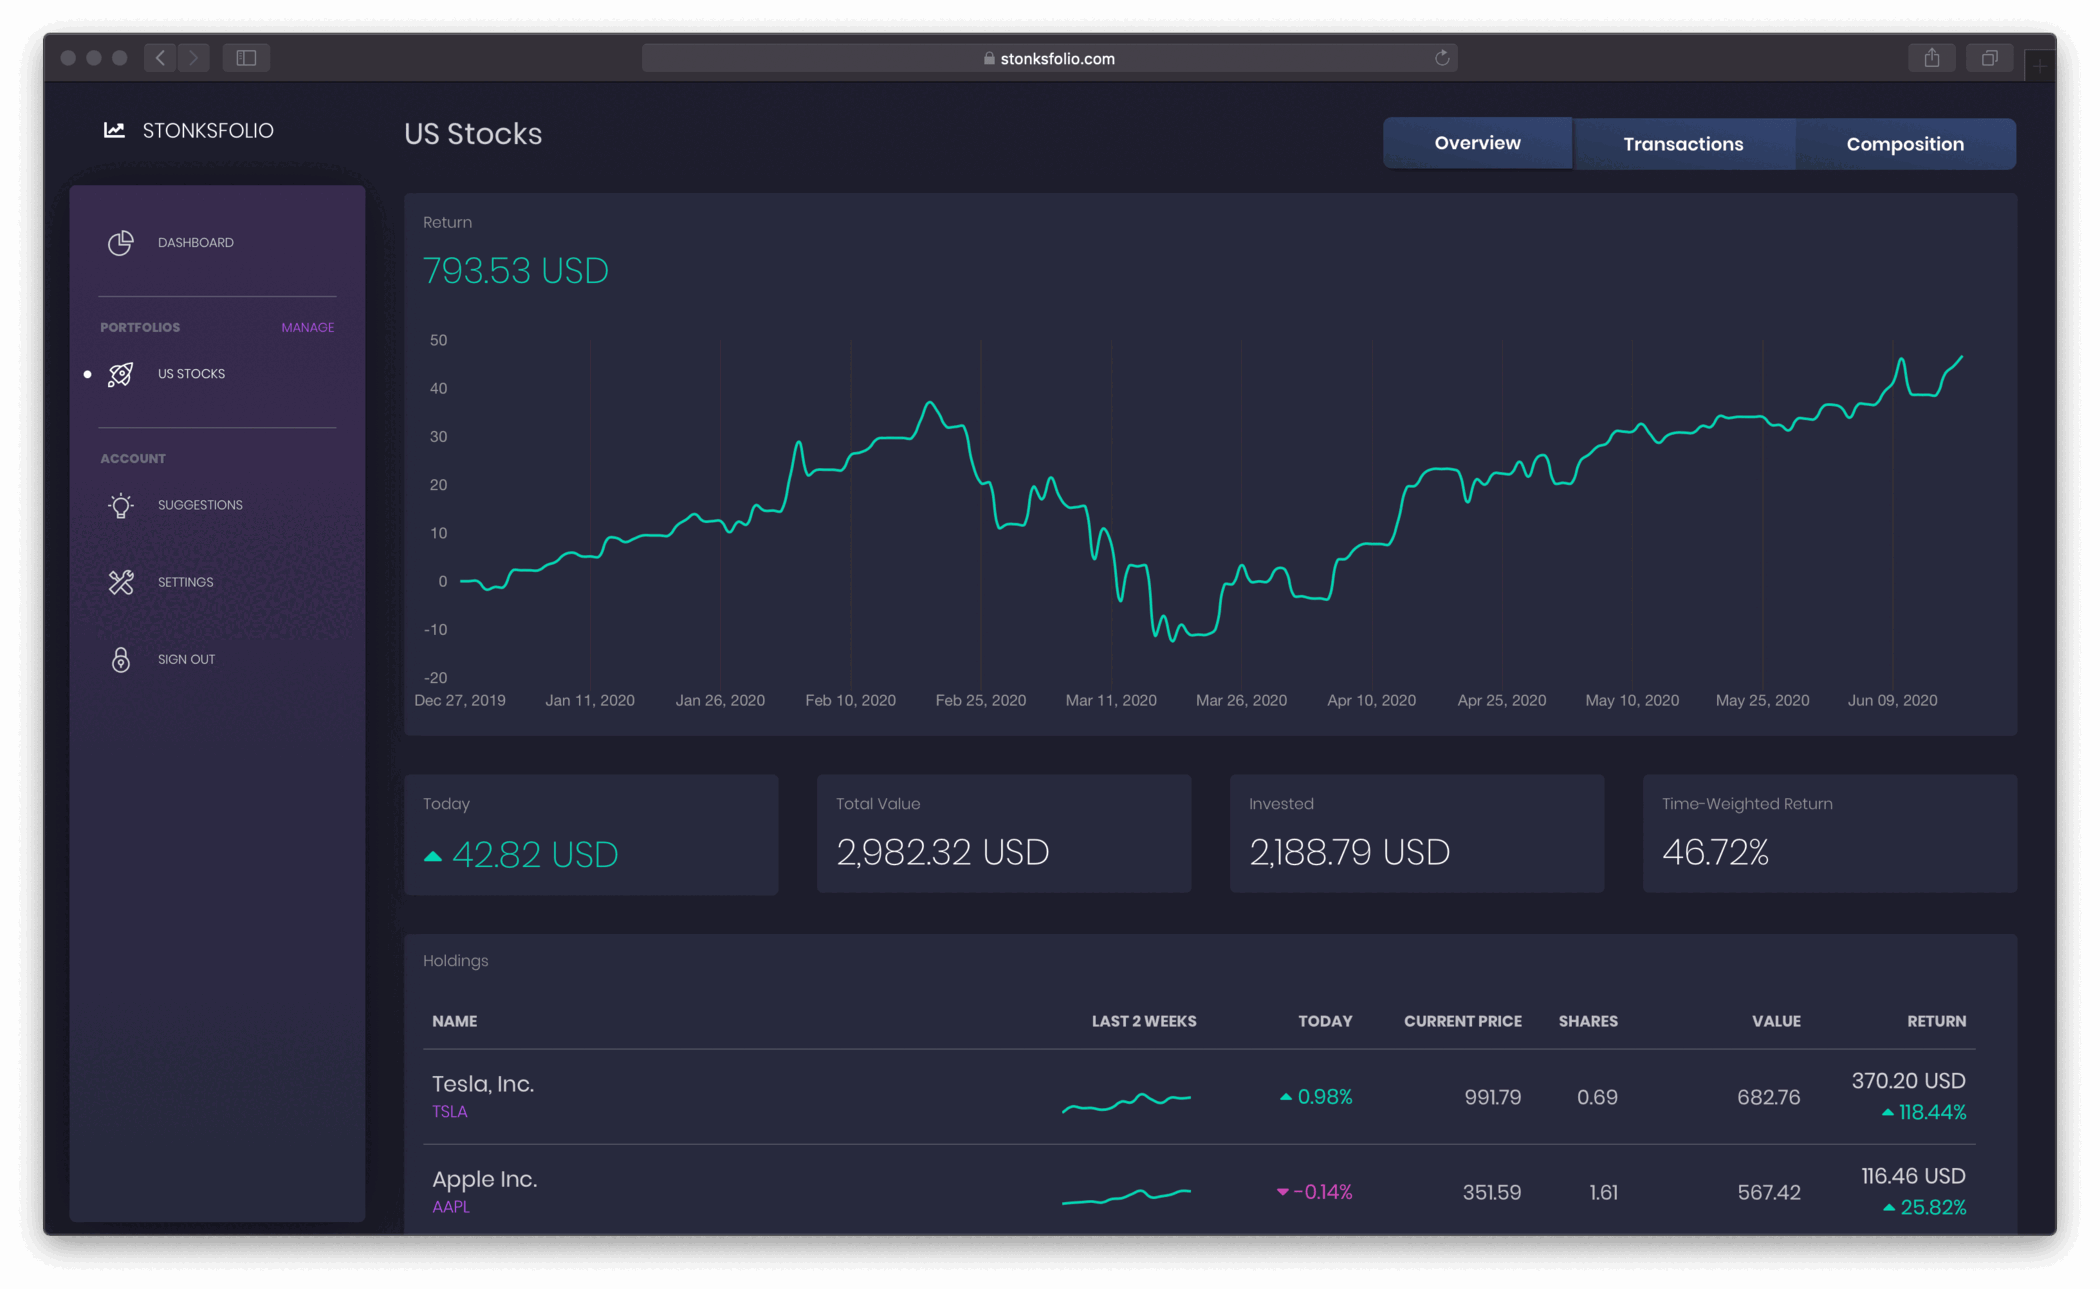
How well did my investments do? The time-weighted return answers that. It ignores when and how much you deposited, so you can compare it with an index or a fund.
How much money did I make? The net return answers that, in money, after every deposit, withdrawal, dividend and fee.
Did you beat the index?
Once your Trading 212 trades are in, put your return next to the S&P 500, MSCI World or gold over the same period, and see whether picking your own investments paid off.
Import from Trading 212 in a few minutes
- Open the ☰ menu in the Trading 212 app and tap History.
- Tap the download icon in the top right corner of the History page.
- Pick the time frame, leave every data type checked and tap Export CSV.
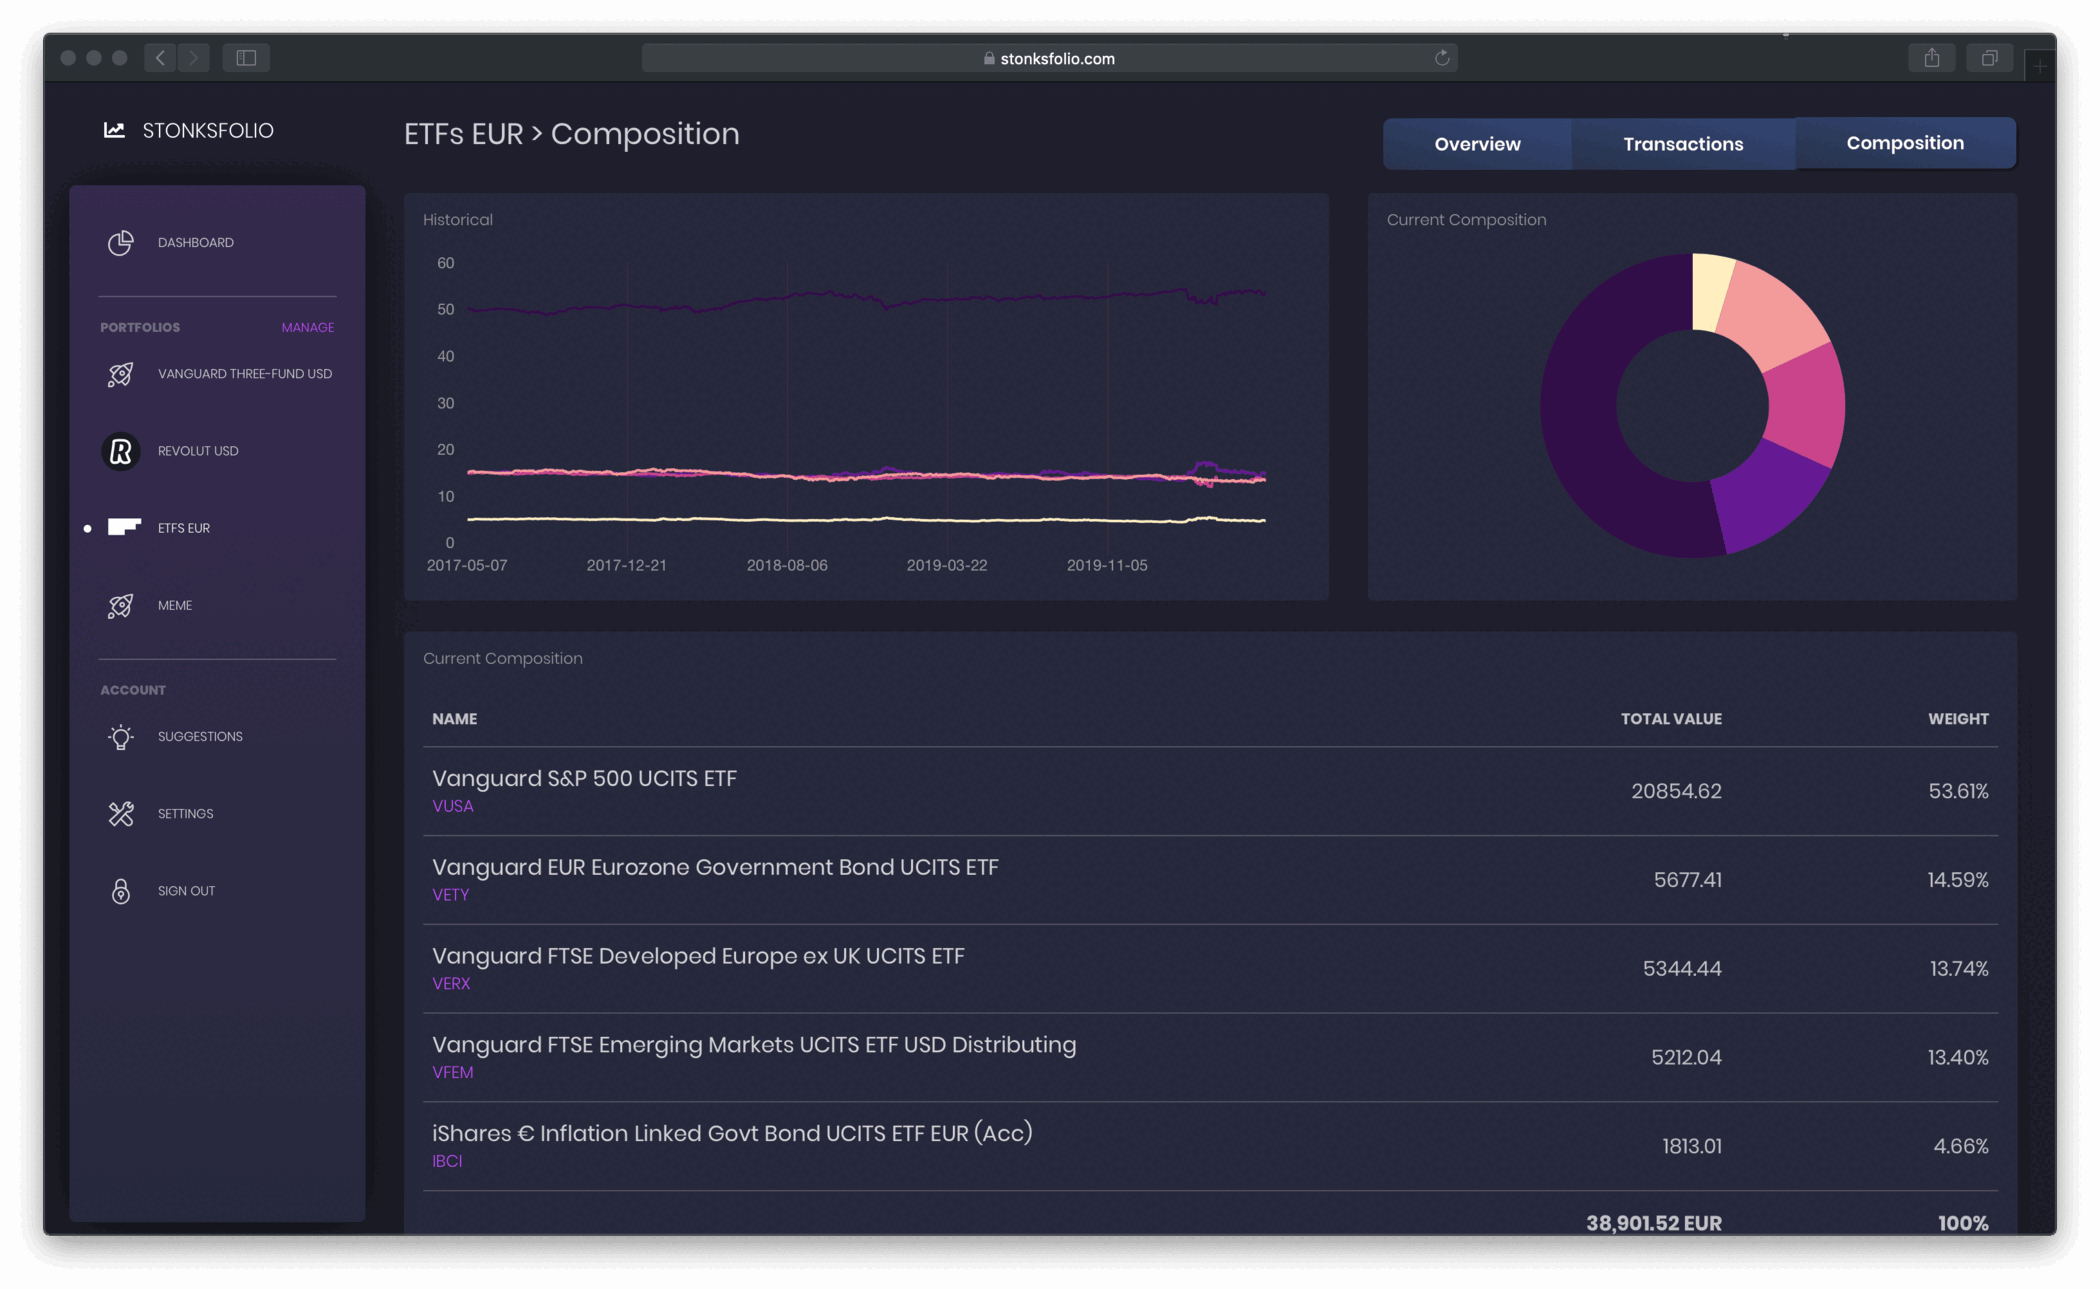
- Upload the file to your portfolio in Stonksfolio and review the trades before they are saved.
Each step is explained in more detail in Trading 212 export to CSV and the Trading 212 import guide.
Questions
How do I see my real return on Trading 212?
Import your Trading 212 history into Stonksfolio. It works out the time-weighted return, the net return in money and the effect of exchange rates from your trades and payments.
What is a time-weighted return?
A return that removes the effect of deposits and withdrawals. It shows how your investments did, regardless of when you added money, so you can compare it with an index or a fund.
Why is my return in Trading 212 different from Stonksfolio's?
A broker usually compares what your holdings are worth with what you paid for them. That mixes in the timing of your deposits and leaves out positions you have sold and dividends paid out as cash.
Can I compare Trading 212 with my other brokers?
Yes. Each broker can be its own portfolio, and the aggregated view on the Pro plan adds them up into one total and one return.
See what your Trading 212 portfolio really earned
It's free to start and you don't need a credit card.